Metrics Gatherer
The Metrics Gatherer (MG) application collects information on the running of your Juno Orion cluster and drives several system metrics, which in turn power detailed dashboards. This gives you rich visuals on cluster performance and resource utilization across your running workloads.
Accessing the Dashboards
MG data is exposed via dashboards in Grafana. We recommend installing the Prometheus Terra Plugin, which is set up to automatically pick up the Juno-provided dashboards, ready for viewing in the Genesis admin console.
Installing the Prometheus Terra Plugin
Step 1 — Find the app
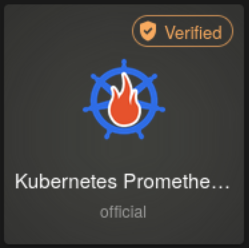
From the Terra App Store within the Genesis admin console, search for "Kubernetes Prometheus Stack" and click it to begin installation.
Step 2 — Fill in the install details
You will be prompted for the following before clicking Install:
| Field | Value |
|---|---|
Install Name |
Any human-readable name |
username |
Admin login for Grafana |
password |
Admin login for Grafana |
host |
FQDN of your Genesis admin console |
path |
/grafana |
Step 3 — Wait for deployment
The application will now deploy to your cluster. You can monitor progress in your ArgoCD dashboard or via the Terra INSTALLS view.
Step 4 — Open Grafana
Once installed, click the  icon in the left-hand taskbar and wait for Grafana to load.
Step 5 — Navigate to Dashboards
In the top-left corner of the Grafana iframe, click the  burger menu and select Dashboards.
Step 6 — Open a Juno dashboard
This view lists all dashboards loaded in your cluster, including some bundled with Kubernetes by default. Two custom dashboards are provided by Juno:
| Dashboard | Purpose |
|---|---|
Workload monitoring |
Visualize workload resource usage across your cluster, broken down by user, namespace, and workload type. |
Consumption token usage |
Track CPU hour consumption against your license tokens, including an estimate of how long your current token will last. |

Workload Monitoring Dashboard
The Workload monitoring dashboard shows how your cluster's resources are actually being used, over the time range selected in the top right of the dashboard.
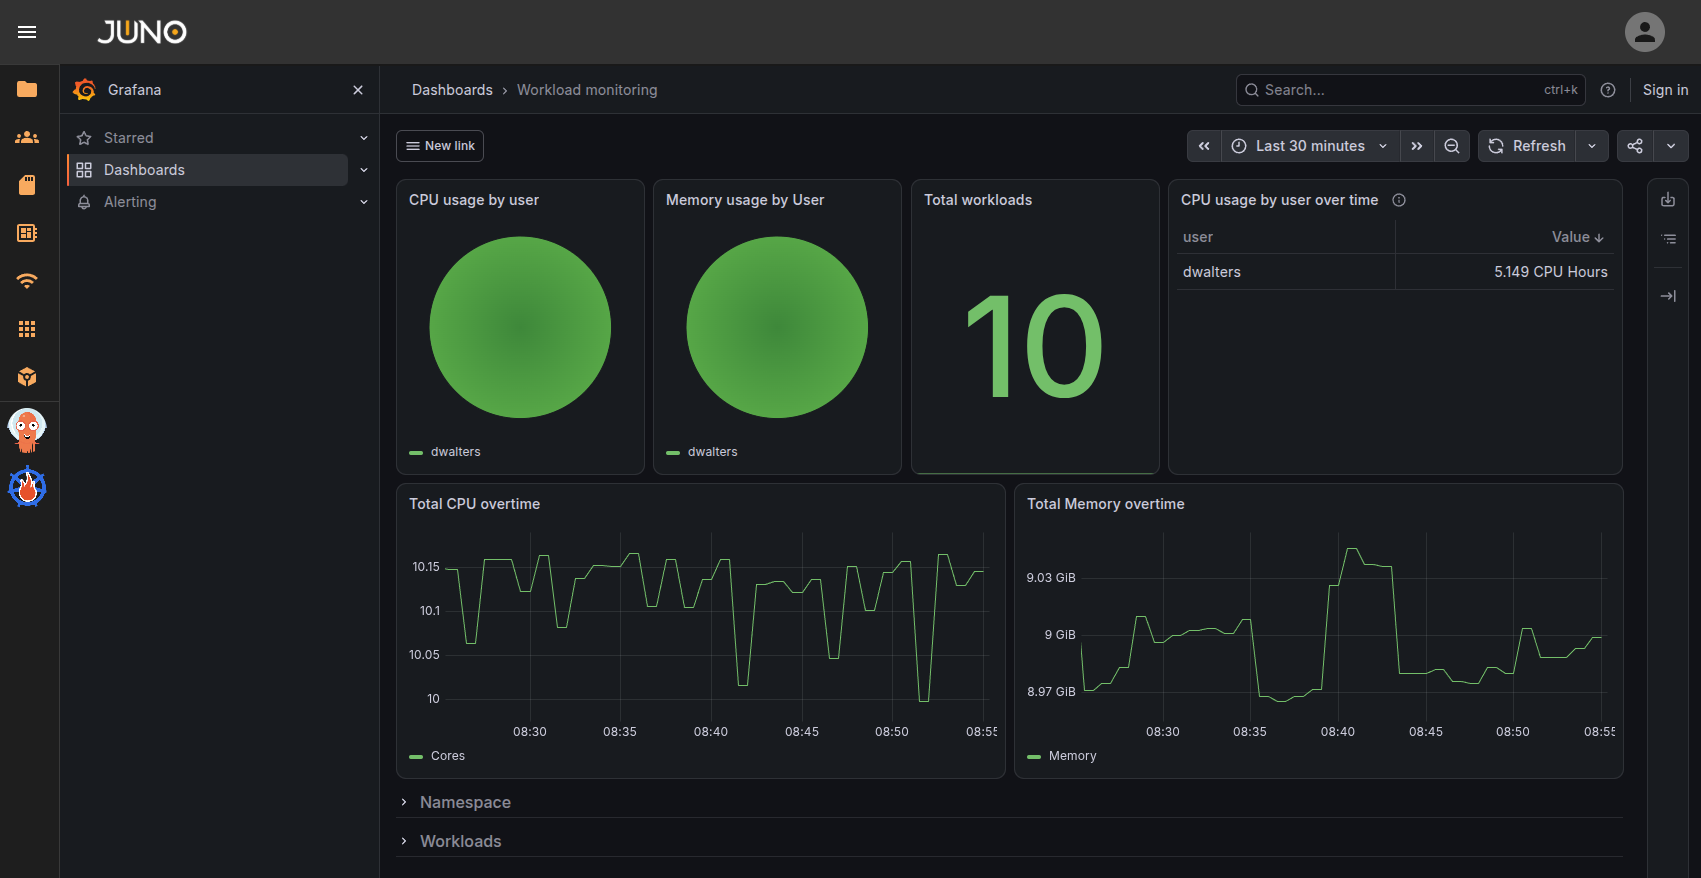
The top of the dashboard summarizes usage per user:
- CPU usage by user and Memory usage by User - the share of the cluster's CPU cores and memory consumed by each user.
- Total workloads - the number of workloads currently running across the cluster.
- CPU usage by user over time - a table of CPU hours consumed per user over the selected time range.
- Total CPU overtime and Total Memory overtime - total cores and memory in use across the cluster, plotted over time.
Below these panels are the Namespace and Workloads rows. Expand either row to break the same usage down by namespace, or by individual workload and workload type, which is useful for identifying which workloads are driving your cluster's resource usage.
Consumption Token Usage Dashboard
The Consumption token usage dashboard is aimed at clusters running a consumption based license. It describes your CPU hour consumption against your current tokens.
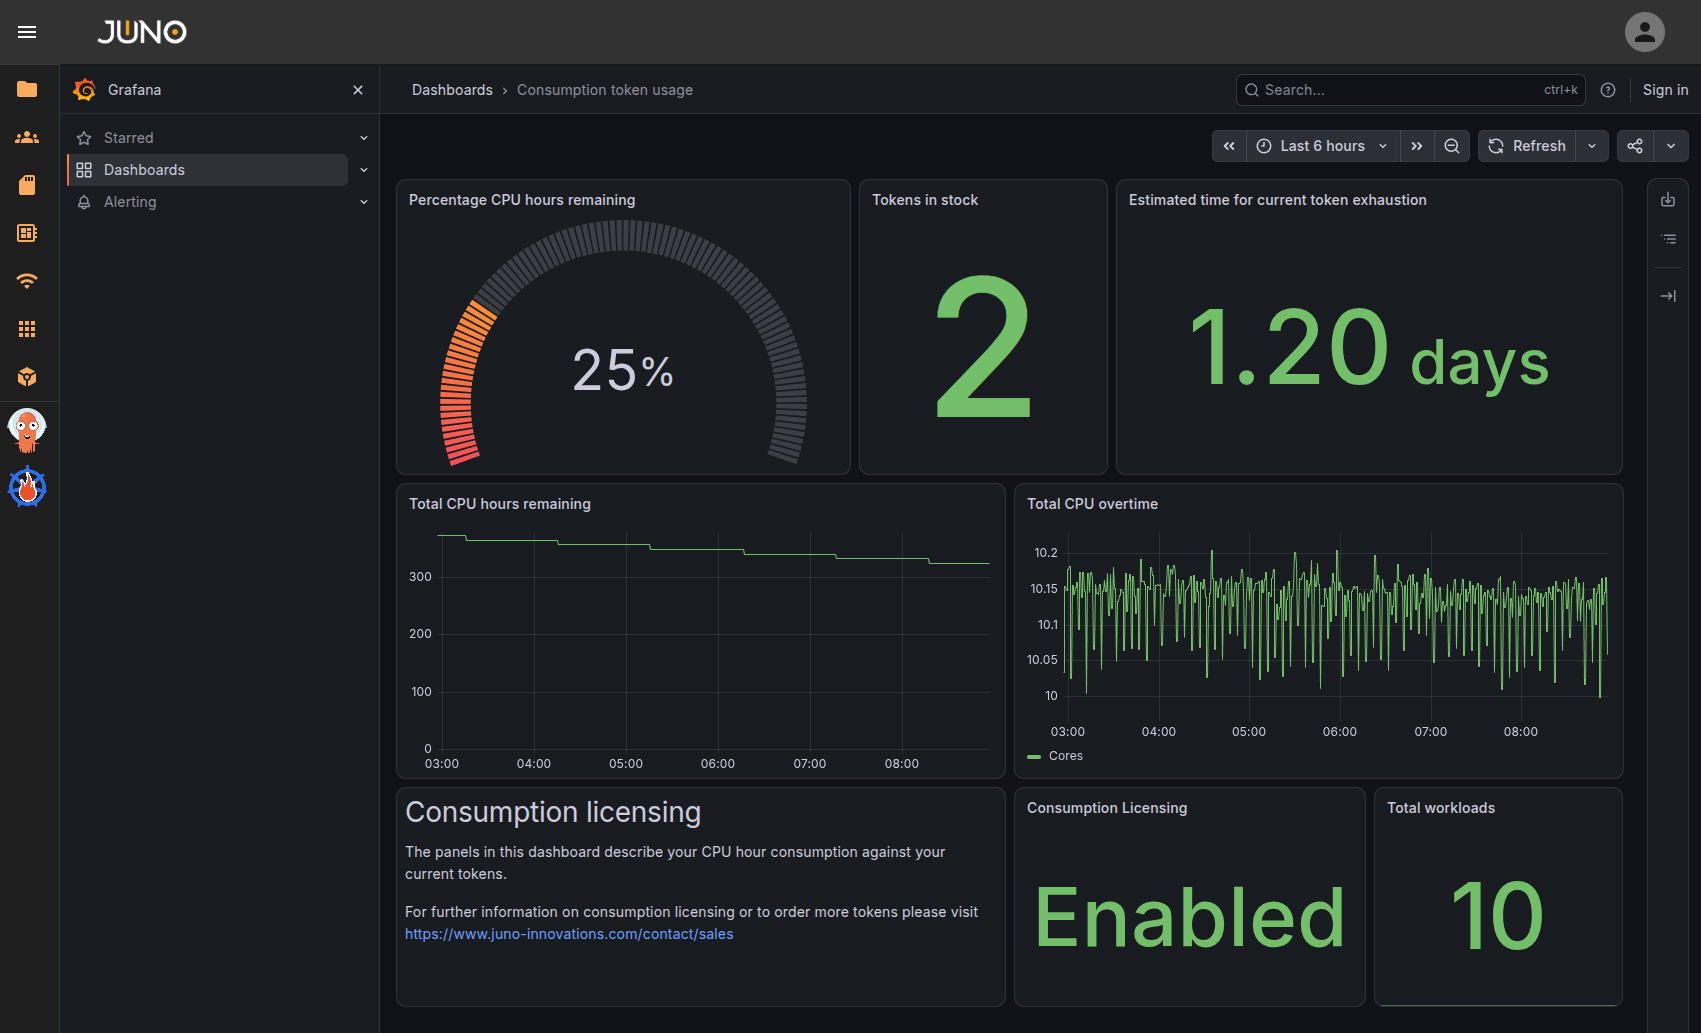
- Percentage CPU hours remaining - how much of the currently active token is left.
- Tokens in stock - the number of consumption tokens issued to your cluster.
- Estimated time for current token exhaustion - a projection, based on your current rate of usage, of how long the active token will last. This figure will move as your cluster's usage changes, so treat it as a guide rather than a fixed date.
- Total CPU hours remaining - your remaining balance plotted over time, stepping down as each hour is deducted.
- Total CPU overtime - the cores in use across the cluster, which is what drives that deduction.
- Consumption Licensing - whether consumption licensing is enabled on this cluster.
- Total workloads - the number of workloads currently running across the cluster.
If you need to order more tokens, the dashboard links to our sales team at https://www.juno-innovations.com/contact/sales.